


Stats don’t match up? We know firsthand how frustrating and confusing it might be. But don’t worry; the HilltopAds team will provide you with all the necessary instructions to sort it out once and for all. If you want to clarify what data discrepancies are, why they happen, and how to avoid and eliminate them, then stick to the very end!
Tracking Discrepancies: Definition, Causes, Ways to Avoid and Eliminate them
Definition
Tracking discrepancy is the difference in data reported by two platforms monitoring the same ad campaign or traffic flow. Typically, these are tracking systems and ad network platforms.
Suppose that your ad campaign got AAA impressions in HilltopAds statistics. On the other hand, the dashboard inside the tracking tool says that the traffic volume is only BBB (BBB < AAA). Then, the tracking discrepancy will be calculated as the difference between them. For convenience, advertisers commonly use the Discrepancy Rate (DR, %):

When dealing with disparities, it’s important to remember that reaching DR=0% is impossible just because of the nature of this phenomenon. In our experience, DR=0% is only seen when the traffic source is full of bot traffic. However, there is a solid benchmark for the discrepancy rate that is considered to be acceptable: DR=30%.
Traffic discrepancy is a serious challenge for everyone involved in affiliate marketing. Since publishers only get paid for high-quality traffic, which is actually counted by our platform, lost traffic means missed monetization opportunities. Advertisers, meanwhile, must take into account the cost of lost traffic when planning their budget and calculating ROI.
Traffic disparities connected to RTB is a subject for another article due to its complex nature.
Common Causes
Finding the real cause (or number of them) of data mismatches requires time and expertise, but it must be done. Otherwise, you will keep losing money, clients, and time spent focusing on other aspects of advertising and monetization rather than trying to understand the data discrepancy phenomenon.
So, what may be the cause of it? There are different reasons for traffic discrepancies:
- A large amount of redirects.
- Incorrect postback setup.
- Tracking tool grouping non-unique impressions.
- Expired cookies.
- Fraudulent activities (e.g., bots, fake leads).
- Different traffic attribution models are used by the tracker and the ad network.
Classification
But not everything about this subject is straightforward. In fact, it’s more tricky than it seems. Let’s break it down. We identify two types of data discrepancies – “hidden” and “explicit”.
Hidden Discrepancies
They occur when neither the advertiser nor the publisher can track the missing traffic. The information about it is hidden from all analytics tools (tracker dashboard, ad network reports). Common causes include instant connection drops, bot traffic, ad blockers, or similar technical errors.
Explicit Discrepancies
It takes place when at least one party can identify the reason behind the disparities. Examples include internal filtering due to bot-like behavior or when a user quickly leaves the page before it’s fully loaded.
Handling significant discrepancies is one of the most critical tasks in optimizing both traffic buying and selling. That’s why we will go deeper into the approaches to resolve these issues.
How to Identify them
Let’s master techniques that will help you detect data disparities faster before they result in unwanted money loss. At HilltopAds, we can identify them only after users report issues. We can’t prevent them earlier because external factors and behind-the-scenes tracker statistics remain hidden from us.
That’s why we encourage you to monitor the discrepancy rate closely from the very beginning of your campaign. Notice a suspicious anomaly? Contact your HilltopAds personal manager, and we will sort it out together!
Expert tip: You can detect local discrepancies by analyzing specific traffic segments (e.g., GEOs). This approach allows you to spot problematic regions and then fine-tune traffic pricing specifically for this market, leaving the high-quality portion of your traffic at a high cost.
How to Resolve Them
At this point, you probably already understand that resolving issues connected with traffic discrepancy is not easy. But don’t worry—HilltopAds has a few ideas for you on how to fight back!
To maintain accuracy in data reporting, please follow these recommendations from HilltopAds Chief Operating Officer!

Rimma
Chief Operating Officer
For Advertisers:
• Set up tracking before launching the ad campaign.
• Run test conversion before starting an actual ad campaign.
• Monitor whether your domain (or any domain used in the redirect chain) is blocked by antivirus software or ad blockers. This approach can prevent you from losing visitors who can’t access your website due to active antivirus.
• Check the page loading speed. If it takes too long for a visitor to see a website’s content, the user will bounce, and the impression will not be counted in analytics. Lightweight pages are especially important in developing countries where internet speeds are often much slower.
• Minimize the number of redirects leading to your final offer. The more redirects you have, the less likely potential clients are to actually make it to the main offer page. This is another reason to work with direct traffic sources instead of resellers.
• Work with HilltopAds! On our end, the HilltopAds team constantly monitors domain reputation indicators from top antivirus platforms and Google Safe Browsing. It allows us to capture the moment when the ad might become problematic—not only for the publisher but for the advertiser as well. The more antivirus systems associate malicious activity with your offer, the lower the chance the audience will eventually see it.
For Publishers:
• Don’t try to mix in traffic from third-party providers. The most probable scenario is that you will get low-quality cheap traffic, which will fail to pass through filtering antivirus detectors.
• HilltopAds provides publishers with advanced anti-adblocker scripts that help bypass known filters and significantly reduce discrepancy rates.
• We purchase ad inventory across all GEOs and targetings from a publisher’s website. This ensures that the publisher receives a 100% fill rate with minimal discrepancy—something not always possible when working with third-party traffic monetization platforms.
Now that we have all the facts about data discrepancy let’s see how significantly this phenomenon affects affiliate statistics depending on the type of ad zone and traffic!
The Exclusive Study about Traffic Discrepancies by Hilltopads
Goal of the Research
We decided to review how significantly data for Popunder Desktop and Popunder Mobile traffic can vary depending on the uniqueness of impressions. In other words, is there any correlation between the ad frequency and the amount of ? Let’s review it!
Discrepancies in Popunder Mobile Traffic
For our research we took data from” Medium” and “Large” Direct zones over the course of one month.
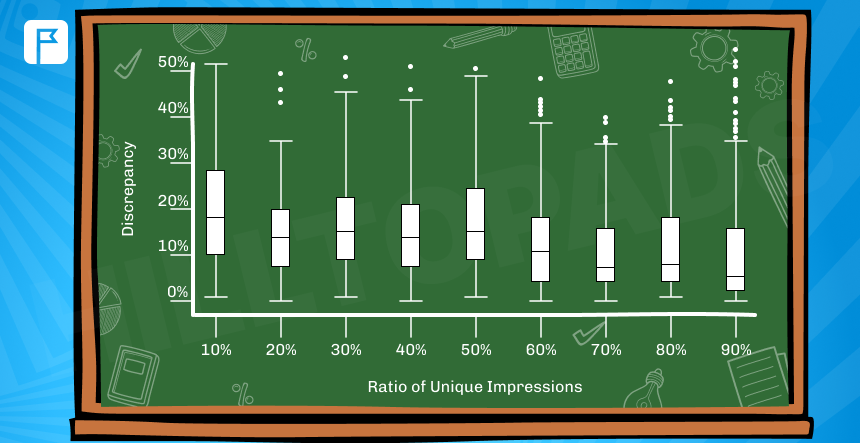
On the graph above you can see how the discrepancy varies depending on the share of unique impressions (i.e. impressions with uniquness = 1) of an ad in mobile popunder traffic.
- The X-axis represents uniqueness.
Note that a value of 10% is equivalent to the uniqueness of impressions in the range of 10% to 20% (compared to the whole volume of tested traffic at this stage), 20%—from 20% to 30%, etc.
- The Y-axis shows discrepancy values.
As a result of this part of the study, all zones can be divided into four groups:
Ultra High Uniqueness (>90%):
Discrepancies are in the range of 0% to 15% (the median value is 6%).
High Uniqueness (60%-90%):
Discrepancies range from 0% to 20% (the median value is 8-10%).
Medium to Low Uniqueness (20%-60%):
The discrepancy is between 5% and 25% (the median value is 13%).
Extremely Low Uniqueness (<20%):
Discrepancies range from 10% to 30% (the median value is 18%).
Therefore, zones with a high-frequency ad display tend to have a discrepancy of 1.5x-3x times higher.
Discrepancies in Popunder Desktop Traffic
The graph below shows the distribution of discrepancy values depending on the share of unique ad impressions for Popunder Desktop zones.
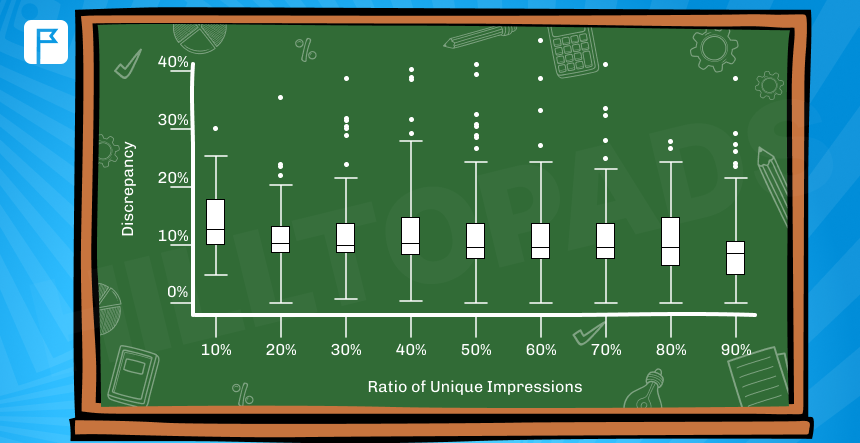
Here is one important highlight from this part of the research. Generally, Unlike the Popunder mobile case, these zones can’t be divided by uniqueness or discrepancy.
The median discrepancy for all zones—except those with extremely low uniqueness (as shown in the left boxplot)—remains between 9% and 11%.
The one noticeable dependence is that the lower the uniqueness, the lower the limit of discrepancies. It gradually rises from 4% at 90%+uniqueness to about 8% at around 30% uniqueness.
Conclusion
There is a strong connection between the frequency (uniqueness) of impressions on a zone and discrepancies in advertisers’ data. Reducing this value will result in higher ad campaign results at a lower cost or bigger monetization revenue without unnecessary traffic loss.
The importance of accurate data reporting is also highlighted by the results of our research. We have proven that in zones with the less frequent ad display (higher impression uniqueness), the discrepancies are getting 1.5x to 3x times decrease. This dependence is even more noticeable in Popunder mobile zones.
You have learnt all the best practices to handle traffic discrepancies. What’s next? Start applying them today – visit your HilltopAds account and boost your profits now!
If you haven’t created an account yet, press the button below to Go to the sign-up form!